Average monthly rainy days in Torrejón el Rubio
The number of days each month with rain, snow and hail in Torrejón el Rubio (Extremadura), Spain.
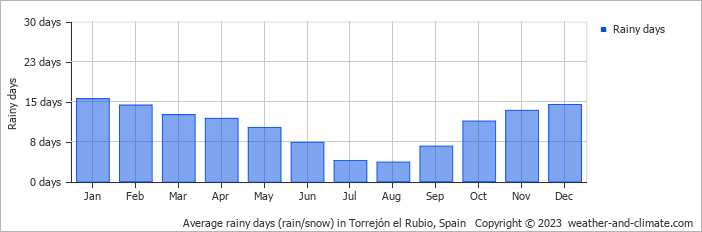
- Most rainy days are in January.
- On average, January is the most rainy with 15 days of rain/snow.
- On average, August is the driest month with 3 rainy days.
- The average annual number of rainy days is 124.
Weather Forecasts for Torrejón el Rubio
Sun Apr 28
18°C | 5°C
W  7 km/h
7 km/halmost clear and no rain
Mon Apr 29
21°C | 7°C
NW 11 km/h
11 km/h0.2 mm
partly cloudy and small chance of slight rain
Tue Apr 30
19°C | 8°C
W 18 km/h
18 km/h3.1 mm
partly cloudy and rain


