Monthly Average Rainy days in Toluca
The number of days each month with rain, snow and hail in Toluca (State of Mexico), Mexico.
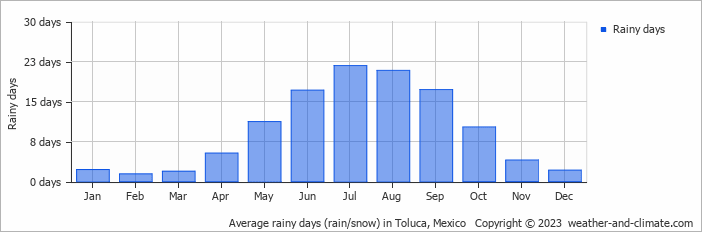
- Most rainy days are in June, July, August and September.
- Toluca has dry periods in February and March.
- On average, July is the most rainy with 21 days of rain/snow.
- On average, February is the driest month with 1 rainy day.
- The average annual number of rainy days is 115.
Current rainfall in Toluca
Thu Nov 21
22°C | 7°C
N  4 km/h
4 km/hbroken clouds and no rain
Fri Nov 22
21°C | 5°C
N 7 km/h
7 km/hbroken clouds and no rain
Sat Nov 23
21°C | 3°C
NW 7 km/h
7 km/hclear and no rain


