Monthly Average Rainy days in Tililaca
The number of days each month with rain, snow and hail in Tililaca (Puno), Peru.
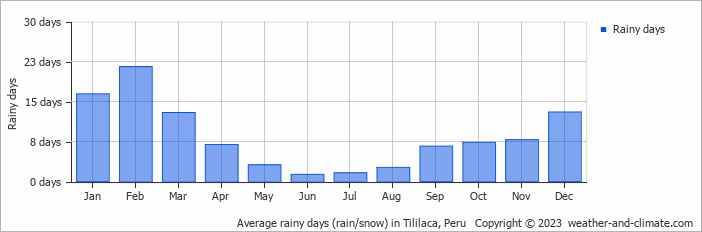
- Most rainy days are in January and February.
- Tililaca has dry periods in June and July.
- On average, February is the most rainy with 21 days of rain/snow.
- On average, June is the driest month with 1 rainy day.
- The average annual number of rainy days is 101.
Current rainfall in Tililaca
Tue Dec 24
18°C | 1°C
NE  5 m/s
5 m/s
5 m/s0.3 mm
partly cloudy and small chance of slight rain
Wed Dec 25
18°C | 1°C
NE 6 m/s
6 m/s0.7 mm
partly cloudy and chance of slight rain
Thu Dec 26
16°C | 4°C
NE 5 m/s
5 m/s0.7 mm
broken clouds and small chance of rain


