Monthly Average Rainy days in Tilcara
The number of days each month with rain, snow and hail in Tilcara (Jujuy), Argentina.
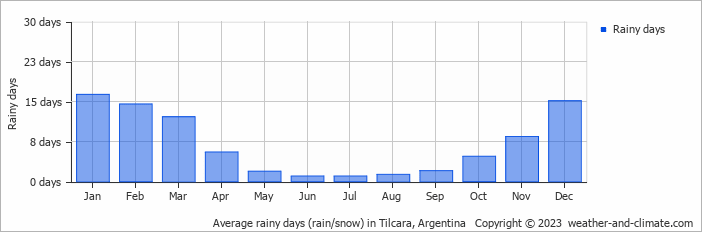
- Most rainy days are in January and December.
- Tilcara has dry periods in May, June, July, August and September.
- On average, January is the most rainy with 16 days of rain/snow.
- On average, July is the driest month with 1 rainy day.
- The average annual number of rainy days is 83.
Current rainfall in Tilcara
Tue Dec 24
15°C | 6°C
S  3 m/s
3 m/s
3 m/s11 mm
broken clouds and thunder
Wed Dec 25
13°C | 5°C
SE 2 m/s
2 m/s6.4 mm
broken clouds and rain
Thu Dec 26
15°C | 4°C
SE 2 m/s
2 m/s1.4 mm
partly cloudy and rain