ClimateForecastMayJune >>

Average monthly rainy days in Tilburg

The number of days each month with rain, snow and hail in Tilburg (Noord-Brabant), the Netherlands.

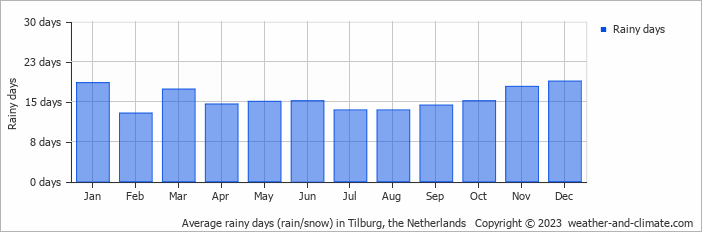
  • Most rainy days are in January, March, May, June, October, November and December.
  • On average, December is the most rainy with 18 days of rain/snow.
  • On average, February is the driest month with 12 rainy days.
  • The average annual number of rainy days is 185.

Weather Forecasts for Tilburg

Wed   May 01
25°C | 13°C
N 18 km/h
1.4 mm
almost clear and small chance of slight rain

almost clear and small chance of slight rain

Thu   May 02
24°C | 13°C
W 14 km/h
5.1 mm
partly cloudy and thunder

partly cloudy and thunder

Fri   May 03
15°C | 9°C
SW 22 km/h
7.8 mm
overcast and heavy rain

overcast and heavy rain

Interested in more climate information?

Weather and Climate provides you with all the information you need about the climate in Tilburg.

Our site offers climate and forecast data for every country in the world. Are you going to the Netherlands? On this website you can find historical weather averages for many cities in the Netherlands. Not sure yet where to go? We now have a tool which recommends destinations that suit your ideal climate conditions. Find out where to go with our weather planner.