Monthly Average Rainy days in Thung Song
The number of days each month with rain, snow and hail in Thung Song (Nakhon Si Thammarat), Thailand.
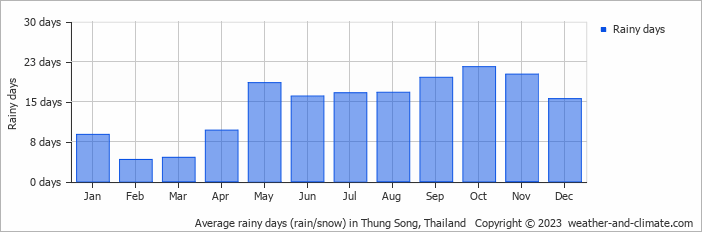
- Most rainy days are in May, June, July, August, September, October, November and December.
- On average, October is the most rainy with 21 days of rain/snow.
- On average, February is the driest month with 4 rainy days.
- The average annual number of rainy days is 171.
Current rainfall in Thung Song
Thu Dec 12
28°C | 23°C
N  4 km/h
4 km/h43 mm
broken clouds and thunder
Fri Dec 13
27°C | 23°C
E 11 km/h
11 km/h22 mm
broken clouds and rain
Sat Dec 14
27°C | 22°C
E 11 km/h
11 km/h11 mm
broken clouds and rain


