Monthly Average Rainy days in Thung Si Kan
The number of days each month with rain, snow and hail in Thung Si Kan (Bangkok Province), Thailand.
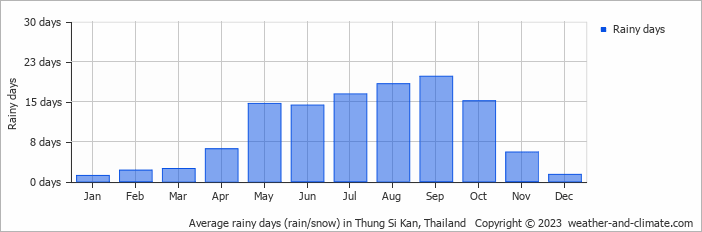
- Most rainy days are in July, August, September and October.
- Thung Si Kan has dry periods in January and December.
- On average, September is the most rainy with 19 days of rain/snow.
- On average, January is the driest month with 1 rainy day.
- The average annual number of rainy days is 116.
Current rainfall in Thung Si Kan
Sun Nov 24
33°C | 26°C
E  14 km/h
14 km/h0.3 mm
partly cloudy and small chance of slight rain
Mon Nov 25
34°C | 27°C
E 14 km/h
14 km/hclear and no rain
Tue Nov 26
33°C | 27°C
E 14 km/h
14 km/h0.2 mm
partly cloudy and small chance of slight rain


