Monthly Average Rainy days in Thrapston
The number of days each month with rain, snow and hail in Thrapston (Northamptonshire), the United Kingdom.
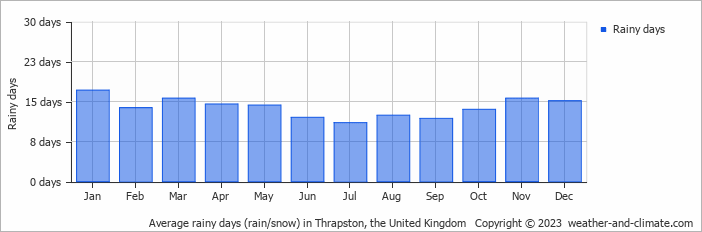
- Most rainy days are in January, March, November and December.
- On average, January is the most rainy with 17 days of rain/snow.
- On average, July is the driest month with 11 rainy days.
- The average annual number of rainy days is 166.
Current rainfall in Thrapston
Sun Jan 05
13°C | 0°C
SW  6 m/s
6 m/s
6 m/s12 mm
overcast and rain
Mon Jan 06
12°C | 2°C
W 8 m/s
8 m/s13 mm
partly cloudy and rain
Tue Jan 07
5°C | 0°C
W 6 m/s
6 m/salmost clear and no rain


