Monthly Average Rainy days in Thong Nai Pan Noi
The number of days each month with rain, snow and hail in Thong Nai Pan Noi (Surat Thani Province), Thailand.
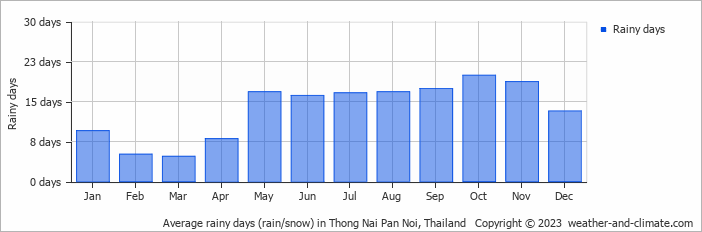
- Most rainy days are in May, June, July, August, September, October and November.
- On average, October is the most rainy with 19 days of rain/snow.
- On average, March is the driest month with 4 rainy days.
- The average annual number of rainy days is 162.
Current rainfall in Thong Nai Pan Noi
Wed Jan 15
29°C | 25°C
N  8 m/s
8 m/s
8 m/sbroken clouds and no rain
Thu Jan 16
30°C | 24°C
NE 8 m/s
8 m/s8.4 mm
broken clouds and rain
Fri Jan 17
29°C | 25°C
NE 9 m/s
9 m/s0.1 mm
broken clouds and small chance of slight rain


