Monthly Average Rainy days in Thatcham
The number of days each month with rain, snow and hail in Thatcham (Berkshire), the United Kingdom.
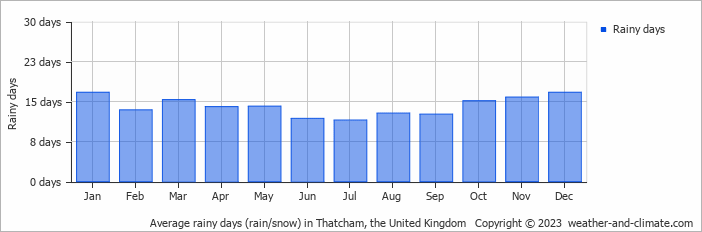
- Most rainy days are in January, March, October, November and December.
- On average, December is the most rainy with 16 days of rain/snow.
- On average, July is the driest month with 11 rainy days.
- The average annual number of rainy days is 170.
Current rainfall in Thatcham
Thu Nov 21
4°C | -2°C
W  11 km/h
11 km/h0.7 mm
partly cloudy and chance of slight snow
Fri Nov 22
6°C | 0°C
W 25 km/h
25 km/h1.5 mm
partly cloudy and no rain
Sat Nov 23
14°C | 0°C
S 36 km/h
36 km/h15 mm
overcast and heavy rain


