Monthly Average Rainy days in Thai Muang
The number of days each month with rain, snow and hail in Thai Muang (Phang Nga Province), Thailand.
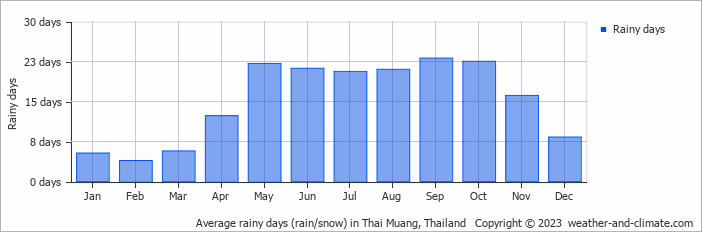
- Most rainy days are in May, June, July, August, September, October and November.
- On average, September is the most rainy with 23 days of rain/snow.
- On average, February is the driest month with 3 rainy days.
- The average annual number of rainy days is 182.
Current rainfall in Thai Muang
Wed Jan 29
33°C | 23°C
E  6 m/s
6 m/s
6 m/s0.5 mm
partly cloudy and chance of slight rain
Thu Jan 30
33°C | 22°C
NW 4 m/s
4 m/spartly cloudy and no rain
Fri Jan 31
32°C | 22°C
W 4 m/s
4 m/salmost clear and no rain


