Monthly Average Rainy days in Tapalpa
The number of days each month with rain, snow and hail in Tapalpa (Jalisco), Mexico.
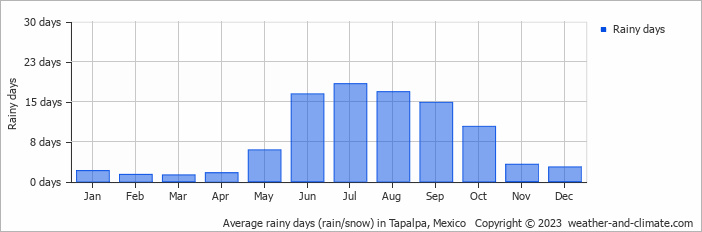
- Most rainy days are in June, July and August.
- Tapalpa has dry periods in January, February, March and April.
- On average, July is the most rainy with 18 days of rain/snow.
- On average, March is the driest month with 1 rainy day.
- The average annual number of rainy days is 94.
Current rainfall in Tapalpa
Fri Nov 22
23°C | 11°C
E  7 km/h
7 km/hpartly cloudy and no rain
Sat Nov 23
23°C | 10°C
W 7 km/h
7 km/hpartly cloudy and no rain
Sun Nov 24
24°C | 10°C
NW 4 km/h
4 km/h0.4 mm
partly cloudy and small chance of slight rain


