Monthly Average Rainy days in Tapachula
The number of days each month with rain, snow and hail in Tapachula (Chiapas), Mexico.
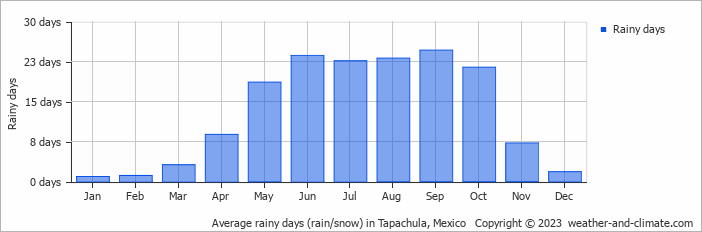
- Most rainy days are in May, June, July, August, September and October.
- Tapachula has dry periods in January, February and December.
- On average, September is the most rainy with 24 days of rain/snow.
- On average, January is the driest month with 0 rainy days.
- The average annual number of rainy days is 156.
Current rainfall in Tapachula
Sun Jan 12
32°C | 21°C
SW  3 m/s
3 m/s
3 m/salmost clear and no rain
Mon Jan 13
33°C | 22°C
W 3 m/s
3 m/s0.3 mm
partly cloudy and small chance of slight rain
Tue Jan 14
34°C | 23°C
SW 3 m/s
3 m/s0.2 mm
partly cloudy and small chance of slight rain


