Monthly Average Rainy days in Tanjung
The number of days each month with rain, snow and hail in Tanjung (Lombok), Indonesia.
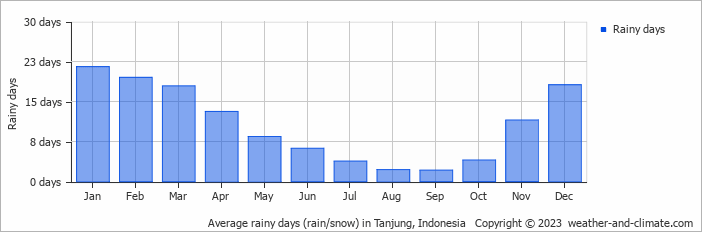
- Most rainy days are in January, February, March and December.
- On average, January is the most rainy with 21 days of rain/snow.
- On average, September is the driest month with 2 rainy days.
- The average annual number of rainy days is 128.
Current rainfall in Tanjung
Sat Nov 23
32°C | 23°C
SE  7 km/h
7 km/h12 mm
broken clouds and thunder
Sun Nov 24
30°C | 24°C
NE 11 km/h
11 km/h10 mm
broken clouds and thunder
Mon Nov 25
31°C | 24°C
N 11 km/h
11 km/h6 mm
broken clouds and thunder


