Monthly Average Rainy days in Tanjong Tokong
The number of days each month with rain, snow and hail in Tanjong Tokong (Penang), Malaysia.
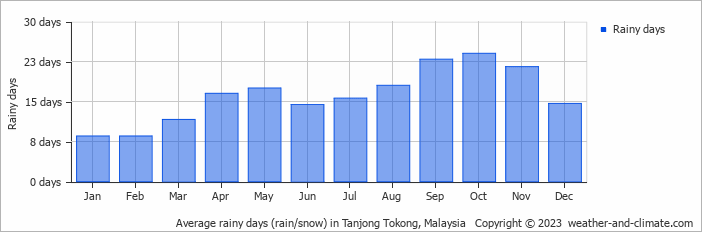
- Most rainy days are in April, May, July, August, September, October and November.
- On average, October is the most rainy with 24 days of rain/snow.
- On average, January is the driest month with 8 rainy days.
- The average annual number of rainy days is 193.
Current rainfall in Tanjong Tokong
Sun Dec 22
33°C | 24°C
NE  3 m/s
3 m/s
3 m/s4.8 mm
partly cloudy and chance of rain
Mon Dec 23
33°C | 24°C
W 3 m/s
3 m/s1.2 mm
broken clouds and chance of rain
Tue Dec 24
32°C | 25°C
NW 4 m/s
4 m/s2.2 mm
broken clouds and rain