Monthly Average Rainy days in Tampin
The number of days each month with rain, snow and hail in Tampin (Melaka), Malaysia.
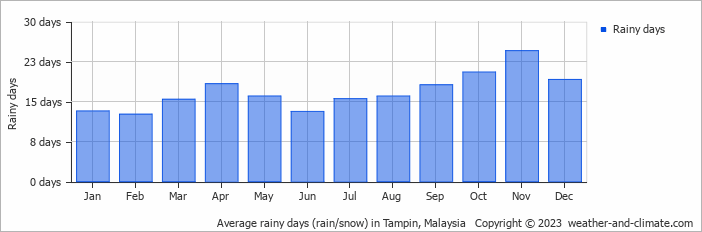
- Most rainy days are in March, April, May, July, August, September, October, November and December.
- On average, November is the most rainy with 24 days of rain/snow.
- On average, February is the driest month with 12 rainy days.
- The average annual number of rainy days is 202.
Current rainfall in Tampin
Tue Jan 07
29°C | 24°C
N  3 m/s
3 m/s
3 m/s4.9 mm
broken clouds and rain
Wed Jan 08
32°C | 24°C
NE 4 m/s
4 m/sbroken clouds and no rain
Thu Jan 09
31°C | 24°C
NE 4 m/s
4 m/sbroken clouds and no rain