Monthly Average Rainy days in Tamarin
The number of days each month with rain, snow and hail in Tamarin (), Mauritius.
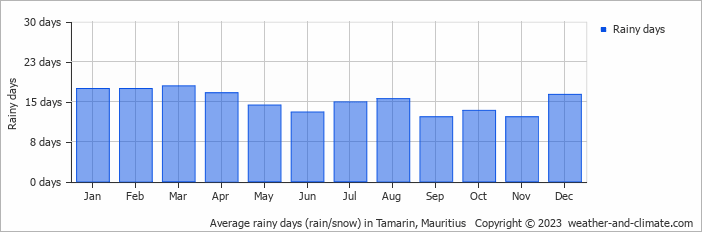
- Most rainy days are in January, February, March, April, August and December.
- On average, March is the most rainy with 17 days of rain/snow.
- On average, November is the driest month with 12 rainy days.
- The average annual number of rainy days is 180.
Current rainfall in Tamarin
Thu Dec 12
30°C | 24°C
E  11 km/h
11 km/halmost clear and no rain
Fri Dec 13
31°C | 23°C
E 14 km/h
14 km/hpartly cloudy and no rain
Sat Dec 14
29°C | 22°C
W 14 km/h
14 km/h0.8 mm
partly cloudy and chance of rain


