ClimateForecastMayJune >>

Average monthly rainy days in South Ponte Vedra Beach

The number of days each month with rain, snow and hail in South Ponte Vedra Beach (), the United States of America.

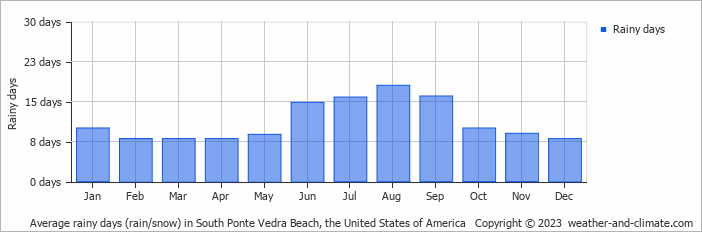
  • Most rainy days are in July, August and September.
  • On average, August is the most rainy with 18 days of rain/snow.
  • On average, December is the driest month with 8 rainy days.
  • The average annual number of rainy days is 134.

Forecast for South Ponte Vedra Beach

Mon   May 06
29°C | 21°C
SE 18 km/h
0.9 mm
broken clouds and thunder

broken clouds and thunder

Tue   May 07
31°C | 20°C
SE 18 km/h
0.4 mm
partly cloudy and small chance of slight rain

partly cloudy and small chance of slight rain

Wed   May 08
32°C | 21°C
SE 14 km/h
almost clear and no rain

almost clear and no rain

Interested in more climate information?

This site provides you with all the information you need about the climate in South Ponte Vedra Beach.

Our site offers climate and forecast data for every country in the world. Are you going to the United States of America? On this website you can find historical weather averages for many cities in the United States of America. Not sure yet where to go? We now have a tool which recommends destinations that suit your ideal climate conditions. Find out where to go with our weather planner.