Monthly Average Rainy days in Sidoarjo
The number of days each month with rain, snow and hail in Sidoarjo (East Java), Indonesia.
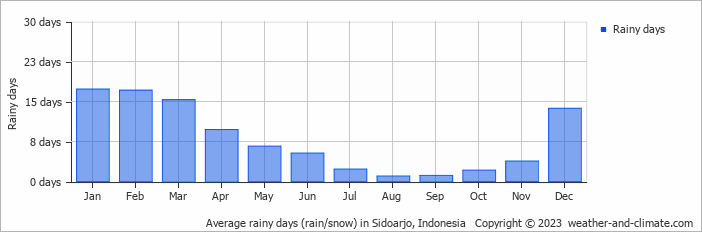
- Most rainy days are in January, February and March.
- Sidoarjo has dry periods in August and September.
- On average, January is the most rainy with 17 days of rain/snow.
- On average, August is the driest month with 1 rainy day.
- The average annual number of rainy days is 95.
Current rainfall in Sidoarjo
Mon Jan 13
32°C | 25°C
NW  3 m/s
3 m/s
3 m/s12 mm
broken clouds and thunder
Tue Jan 14
32°C | 25°C
NW 3 m/s
3 m/s24 mm
broken clouds and thunder
Wed Jan 15
32°C | 25°C
W 5 m/s
5 m/s12 mm
broken clouds and thunder


