Monthly Average Rainy days in Sayulita
The number of days each month with rain, snow and hail in Sayulita (Riviera Nayarit), Mexico.
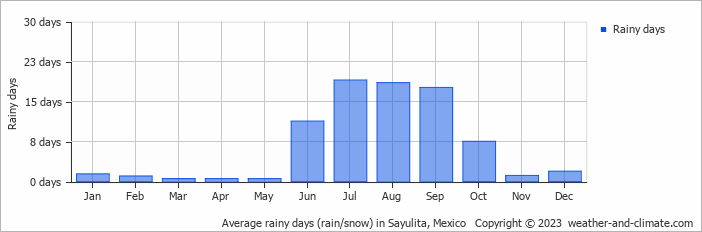
- Most rainy days are in July, August and September.
- Sayulita has dry periods in January, February, March, April, May, November and December.
- On average, July is the most rainy with 19 days of rain/snow.
- On average, May is the driest month with 0 rainy days.
- The average annual number of rainy days is 80.
Current rainfall in Sayulita
Sun Dec 15
29°C | 17°C
W  7 km/h
7 km/hpartly cloudy and no rain
Mon Dec 16
28°C | 20°C
N 11 km/h
11 km/hbroken clouds and no rain
Tue Dec 17
27°C | 19°C
NW 7 km/h
7 km/halmost clear and no rain


