Monthly Average Rainy days in Sao Jose do Rio Preto
The number of days each month with rain, snow and hail in Sao Jose do Rio Preto (Sao Paulo State), Brazil.
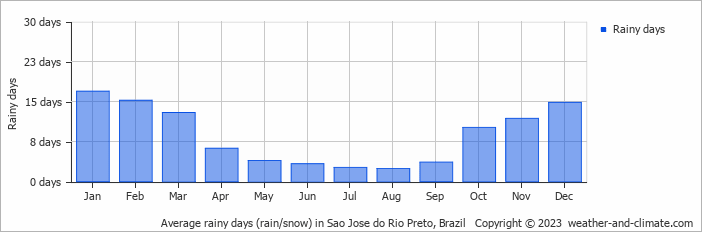
- Most rainy days are in January and February.
- On average, January is the most rainy with 16 days of rain/snow.
- On average, August is the driest month with 2 rainy days.
- The average annual number of rainy days is 103.
Current rainfall in Sao Jose do Rio Preto
Sun Dec 22
30°C | 22°C
NW  3 m/s
3 m/s
3 m/s17 mm
broken clouds and thunder
Mon Dec 23
31°C | 22°C
S 3 m/s
3 m/s1.1 mm
broken clouds and rain
Tue Dec 24
32°C | 21°C
NE 3 m/s
3 m/s1.1 mm
partly cloudy and chance of rain