ClimateForecastAprilMay >>

Average monthly rainy days in Sanur

The number of days each month with rain, snow and hail in Sanur (Bali), Indonesia.

Average monthly rainy days in Sanur,

Feel free to add this climate graph to your website. Click the copy button above.

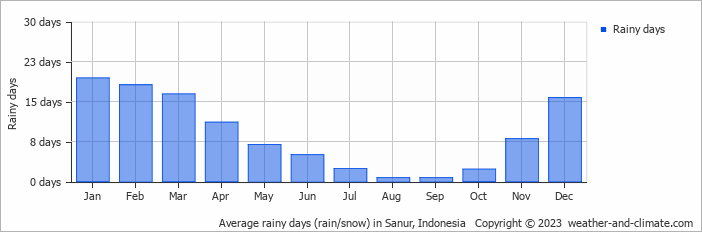
  • Most rainy days are in January, February, March and December.
  • Sanur has dry periods in August and September.
  • On average, January is the most rainy with 19 days of rain/snow.
  • On average, August is the driest month with 0 rainy days.
  • The average annual number of rainy days is 106.

Weather Forecasts for Sanur

Sat   Apr 20
32°C | 24°C
SE 14 km/h
broken clouds and no rain

broken clouds and no rain

Sun   Apr 21
32°C | 25°C
E 7 km/h
6.6 mm
broken clouds and thunder

broken clouds and thunder

Mon   Apr 22
31°C | 25°C
SE 14 km/h
9.1 mm
broken clouds and thunder

broken clouds and thunder

Interested in more climate information?

Weather and Climate provides you with all the information you need about the climate in Sanur.

Our site offers climate and forecast data for every country in the world. Are you going to Indonesia? On this website you can find historical weather averages for many cities in Indonesia. Not sure yet where to go? We now have a tool which recommends destinations that suit your ideal climate conditions. Find out where to go with our weather planner.