Monthly Average Rainy days in San Juan Cosalá
The number of days each month with rain, snow and hail in San Juan Cosalá (Jalisco), Mexico.
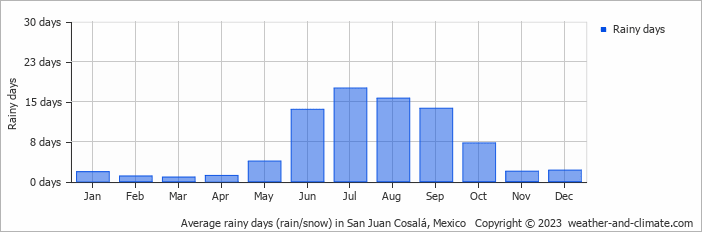
- Most rainy days are in July and August.
- San Juan Cosalá has dry periods in January, February, March, April and November.
- On average, July is the most rainy with 17 days of rain/snow.
- On average, March is the driest month with 0 rainy days.
- The average annual number of rainy days is 80.
Current rainfall in San Juan Cosalá
Sun Jan 05
23°C | 10°C
W  1 m/s
1 m/s
1 m/sclear and no rain
Mon Jan 06
22°C | 9°C
E 2 m/s
2 m/sbroken clouds and no rain
Tue Jan 07
22°C | 12°C
W 2 m/s
2 m/sovercast and no rain


