ClimateForecastMayJune >>

Average monthly rainy days in Rødberg

The number of days each month with rain, snow and hail in Rødberg (Buskerud), Norway.

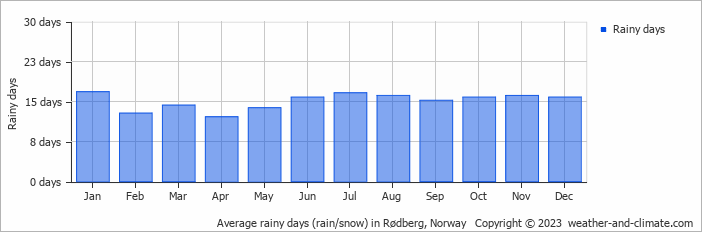
  • Most rainy days are in January, June, July, August, September, October, November and December.
  • On average, January is the most rainy with 16 days of rain/snow.
  • On average, April is the driest month with 12 rainy days.
  • The average annual number of rainy days is 181.

Forecast for Rødberg

Mon   May 06
10°C | 2°C
E 4 km/h
2.3 mm
overcast and slight rain

overcast and slight rain

Tue   May 07
11°C | 2°C
NW 7 km/h
0.9 mm
broken clouds and  chance of rain

broken clouds and chance of rain

Wed   May 08
11°C | 3°C
SE 7 km/h
1.8 mm
broken clouds and small chance of slight rain

broken clouds and small chance of slight rain

Interested in more climate information?

This site provides you with all the information you need about the climate in Rødberg.

Our site offers climate and forecast data for every country in the world. Are you going to Norway? On this website you can find historical weather averages for many cities in Norway. Not sure yet where to go? We now have a tool which recommends destinations that suit your ideal climate conditions. Find out where to go with our weather planner.