Monthly Average Rainy days in Road Town
The number of days each month with rain, snow and hail in Road Town (Tortola), UK Virgin Islands.
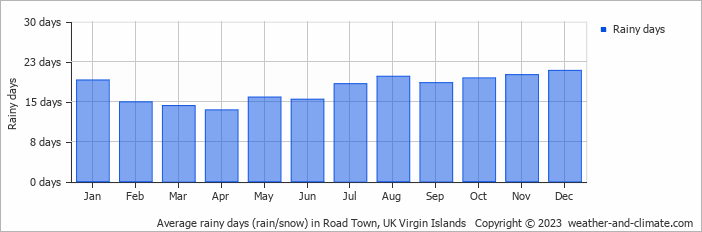
- Most rainy days are in January, May, June, July, August, September, October, November and December.
- On average, December is the most rainy with 20 days of rain/snow.
- On average, April is the driest month with 13 rainy days.
- The average annual number of rainy days is 209.
Current rainfall in Road Town
Wed Jan 15
28°C | 24°C
NE  9 m/s
9 m/s
9 m/spartly cloudy and no rain
Thu Jan 16
28°C | 24°C
NE 9 m/s
9 m/spartly cloudy and no rain
Fri Jan 17
29°C | 24°C
NE 8 m/s
8 m/s1.2 mm
partly cloudy and chance of slight rain


