Average monthly rainy days in Riviera de São Lourenço

The number of days each month with rain, snow and hail in Riviera de São Lourenço (Sao Paulo State), Brazil.

Average monthly rainy days in Riviera de São Lourenço,

Feel free to add this climate graph to your website. Click the copy button above.

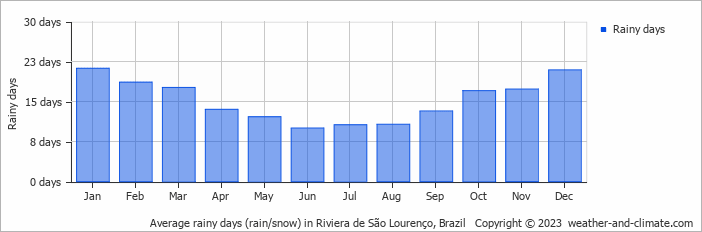
  • Most rainy days are in January, February, March, October, November and December.
  • On average, January is the most rainy with 21 days of rain/snow.
  • On average, June is the driest month with 10 rainy days.
  • The average annual number of rainy days is 182.

Weather Forecasts for Riviera de São Lourenço

Thu   Mar 28
23°C | 21°C
SE 7 km/h
7.9 mm
broken clouds and rain

broken clouds and rain

Fri   Mar 29
25°C | 20°C
SE 7 km/h
2.3 mm
broken clouds and rain

broken clouds and rain

Sat   Mar 30
26°C | 20°C
S 11 km/h
1.9 mm
broken clouds and rain

broken clouds and rain

Interested in more climate information?

Weather and Climate provides you with all the information you need about the climate in Riviera de São Lourenço.

Our site offers climate and forecast data for every country in the world. Are you going to Brazil? On this website you can find historical weather averages for many cities in Brazil. Not sure yet where to go? We now have a tool which recommends destinations that suit your ideal climate conditions. Find out where to go with our weather planner.