Monthly Average Rainy days in Rioja
The number of days each month with rain, snow and hail in Rioja (), Peru.
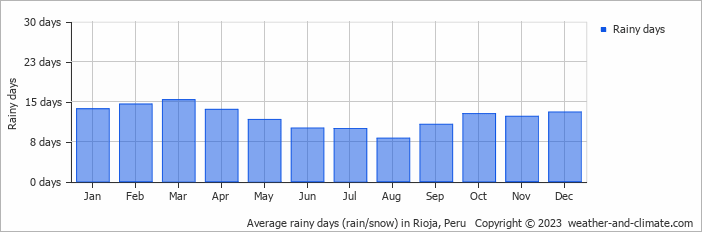
- Most rainy days are in March.
- On average, March is the most rainy with 15 days of rain/snow.
- On average, August is the driest month with 8 rainy days.
- The average annual number of rainy days is 145.
Current rainfall in Rioja
Thu Dec 12
30°C | 18°C
N  7 km/h
7 km/h0.7 mm
broken clouds and slight rain
Fri Dec 13
29°C | 18°C
N 7 km/h
7 km/h6.7 mm
broken clouds and thunder
Sat Dec 14
28°C | 19°C
NW 7 km/h
7 km/h7.2 mm
broken clouds and thunder


