ClimateForecastAprilMay >>

Average monthly rainy days in Ribeira Brava

The number of days each month with rain, snow and hail in Ribeira Brava (Madeira Islands), Portugal.

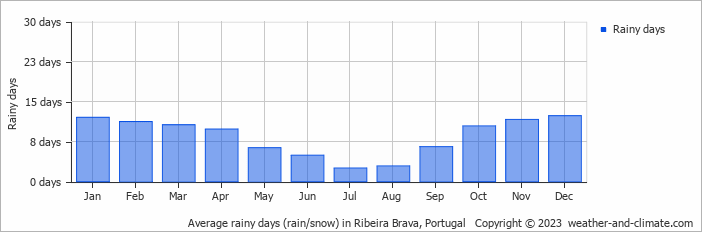
  • On average, December is the most rainy with 12 days of rain/snow.
  • On average, July is the driest month with 2 rainy days.
  • The average annual number of rainy days is 100.

Weather Forecasts for Ribeira Brava

Mon   Apr 29
21°C | 10°C
N 7 km/h
broken clouds and no rain

broken clouds and no rain

Tue   Apr 30
22°C | 16°C
N 7 km/h
1.3 mm
broken clouds and small chance of rain

broken clouds and small chance of rain

Wed   May 01
22°C | 16°C
N 7 km/h
4 mm
overcast and rain

overcast and rain

Interested in more climate information?

Weather and Climate provides you with all the information you need about the climate in Ribeira Brava.

Our site offers climate and forecast data for every country in the world. Are you going to Portugal? On this website you can find historical weather averages for many cities in Portugal. Not sure yet where to go? We now have a tool which recommends destinations that suit your ideal climate conditions. Find out where to go with our weather planner.