ClimateForecastMayJune >>

Average monthly rainy days in Qingtian

The number of days each month with rain, snow and hail in Qingtian (), China.

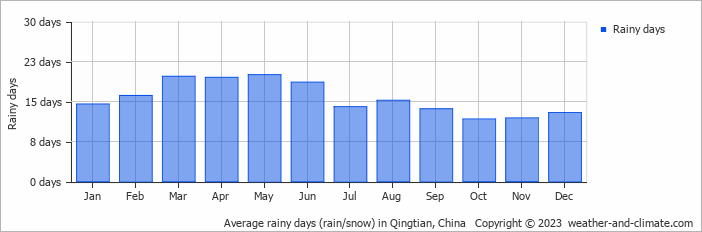
  • Most rainy days are in February, March, April, May, June and August.
  • On average, May is the most rainy with 20 days of rain/snow.
  • On average, October is the driest month with 11 rainy days.
  • The average annual number of rainy days is 187.

Forecast for Qingtian

Mon   May 06
28°C | 17°C
NW 11 km/h
partly cloudy and no rain

partly cloudy and no rain

Tue   May 07
28°C | 17°C
E 7 km/h
broken clouds and no rain

broken clouds and no rain

Wed   May 08
26°C | 16°C
N 7 km/h
1 mm
partly cloudy and rain

partly cloudy and rain

Interested in more climate information?

This site provides you with all the information you need about the climate in Qingtian.

Our site offers climate and forecast data for every country in the world. Are you going to China? On this website you can find historical weather averages for many cities in China. Not sure yet where to go? We now have a tool which recommends destinations that suit your ideal climate conditions. Find out where to go with our weather planner.