Monthly Average Rainy days in Punta de Lanza
The number of days each month with rain, snow and hail in Punta de Lanza (), Costa Rica.
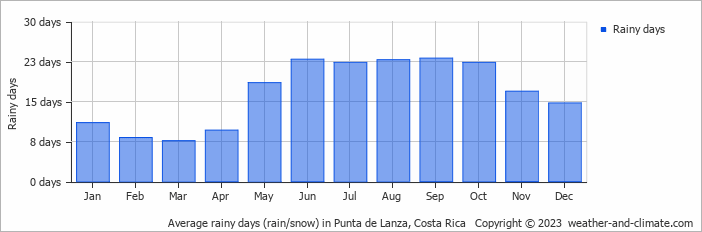
- Most rainy days are in May, June, July, August, September, October and November.
- On average, September is the most rainy with 23 days of rain/snow.
- On average, March is the driest month with 7 rainy days.
- The average annual number of rainy days is 199.
Current rainfall in Punta de Lanza
Wed Jan 15
28°C | 21°C
NE  4 m/s
4 m/s
4 m/s1.6 mm
partly cloudy and slight rain
Thu Jan 16
29°C | 19°C
E 2 m/s
2 m/s1.9 mm
partly cloudy and rain
Fri Jan 17
28°C | 20°C
E 2 m/s
2 m/s3.6 mm
broken clouds and rain