Monthly Average Rainy days in Pula
The number of days each month with rain, snow and hail in Pula (Istria), Croatia.
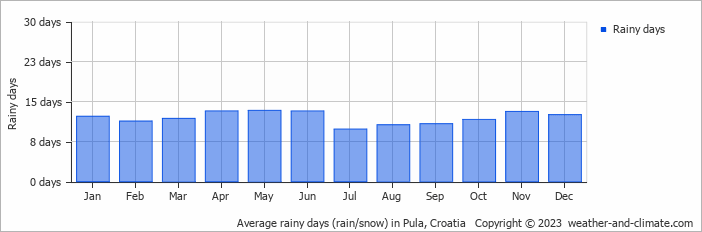
- On average, May is the most rainy with 13 days of rain/snow.
- On average, July is the driest month with 9 rainy days.
- The average annual number of rainy days is 143.
Current rainfall in Pula
Sun Dec 22
11°C | 1°C
S  5 m/s
5 m/s
5 m/s15 mm
broken clouds and rain
Mon Dec 23
8°C | 2°C
N 6 m/s
6 m/s4.6 mm
broken clouds and chance of rain
Tue Dec 24
10°C | 1°C
N 6 m/s
6 m/sbroken clouds and no rain


