Average Rainy - Precipitation days in Port Harcourt
With 154 days and 2808 mm of annual rain, Port Harcourt has a moderate precipitation pattern. On this page, you can learn everything about the number of precipitation days.
Monthly Distribution of Rainy Days
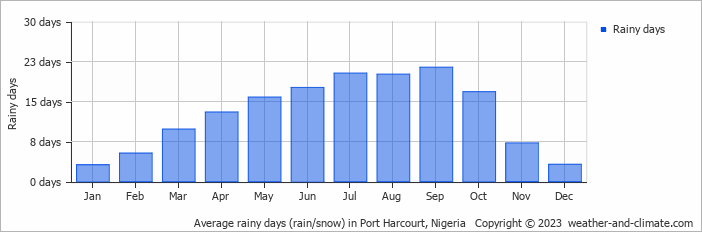
Precipitation peaks in June with 364 mm falling over 18 rainy days. The driest period is January, receiving 54 mm across 3 rainy days.
Amsterdam Precipitation Days Compared World Wide
On average, Port Harcourt receives over 154 days of precipitation annually. For comparison, here is some data from popular tourist destinations around the world:In Cairo, Egypt, there are only about 16 precipitation days annually, making it one of the driest capitals in the world.
In Bogotá, Colombia, there are around 188 precipitation days annually, typical for its high-altitude tropical climate.
In Barcelona, Spain, there are approximately 121 precipitation days per year, evenly distributed across the year with no extreme wet or dry seasons.
The climate in San Francisco, USA, sees around 70 precipitation days annually, mostly during the winter months.
In Seoul, South Korea, the city experiences 106 precipitation days annually, with most rain falling during the summer monsoon season.
Perth, Australia, sees approximately 103 precipitation days annually, mostly during the winter months.
Fun facts about Rain from Around the World
Here are some amazing facts about rain and precipitation worldwide:
- Cherrapunji, India, records an average of 322 rainy days each year. Despite this, the wettest place is Mount Waialeale in Hawaii with 11500 mm annual rainfall.
- The fastest recorded raindrop fell at 18 meters per second during a thunderstorm in Brazil.
- The Atacama Desert in Chile is so dry that some weather stations have never recorded rainfall since their installation.
- The largest recorded raindrop measured 8.8 mm in diameter during a tropical storm on La Réunion Island.
- Some clouds can weigh up to 500,000 tons, that's equivalent to the weight of 100 elephants.
For more detailed information about rainfall patterns in Port Harcourt, visit our Rainfall & Precipitation page.
Current rainfall in Port Harcourt
 3 m/s
3 m/spartly cloudy and no rain
3 m/spartly cloudy and no rain
4 m/spartly cloudy and chance of slight rain


