Monthly Average Rainy days in Pitong
The number of days each month with rain, snow and hail in Pitong (), China.
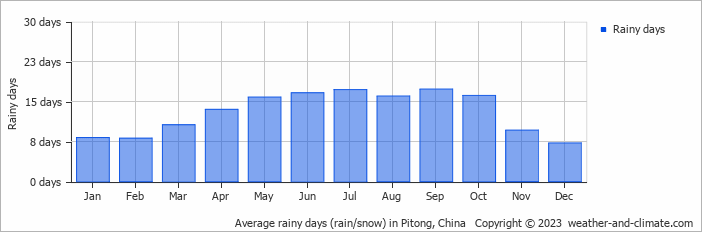
- Most rainy days are in May, June, July, August, September and October.
- On average, September is the most rainy with 17 days of rain/snow.
- On average, December is the driest month with 7 rainy days.
- The average annual number of rainy days is 156.
Current rainfall in Pitong
Sun Nov 24
14°C | 9°C
NE  11 km/h
11 km/h3.8 mm
overcast and rain
Mon Nov 25
11°C | 6°C
S 11 km/h
11 km/hbroken clouds and no rain
Tue Nov 26
11°C | 5°C
SW 11 km/h
11 km/h0.2 mm
overcast and small chance of slight rain


