Monthly Average Rainy days in Pitlochry
The number of days each month with rain, snow and hail in Pitlochry (Tayside), the United Kingdom.
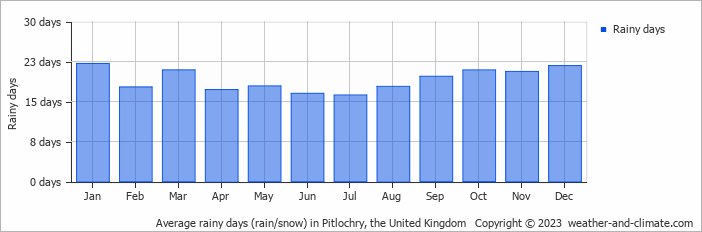
- Most rainy days are in January, February, March, April, May, June, July, August, September, October, November and December.
- On average, January is the most rainy with 22 days of rain/snow.
- On average, July is the driest month with 16 rainy days.
- The average annual number of rainy days is 229.
Current rainfall in Pitlochry
Fri Nov 15
13°C | 7°C
W  22 km/h
22 km/hbroken clouds and no rain
Sat Nov 16
6°C | 1°C
W 22 km/h
22 km/h0.3 mm
partly cloudy and chance of slight rain
Sun Nov 17
3°C | -3°C
NW 22 km/h
22 km/halmost clear and no rain


