Monthly Average Rainy days in Phetchabun
The number of days each month with rain, snow and hail in Phetchabun (Phetchabun Province), Thailand.
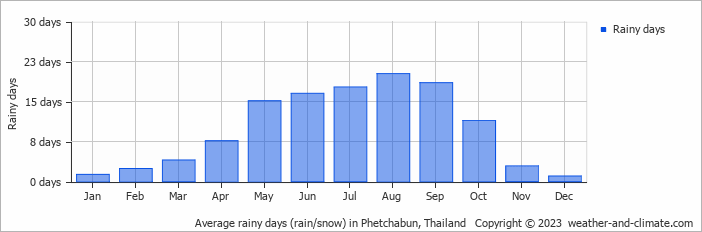
- Most rainy days are in May, June, July, August and September.
- Phetchabun has dry periods in January and December.
- On average, August is the most rainy with 20 days of rain/snow.
- On average, December is the driest month with 1 rainy day.
- The average annual number of rainy days is 118.
Current rainfall in Phetchabun
Wed Jan 15
31°C | 14°C
N  1 m/s
1 m/s
1 m/sclear and no rain
Thu Jan 16
31°C | 17°C
N 1 m/s
1 m/sclear and no rain
Fri Jan 17
31°C | 15°C
N 1 m/s
1 m/sclear and no rain


