ClimateForecastAprilMay >>

Average monthly rainy days in Paysandú

The number of days each month with rain, snow and hail in Paysandú (Paysandu), Uruguay.

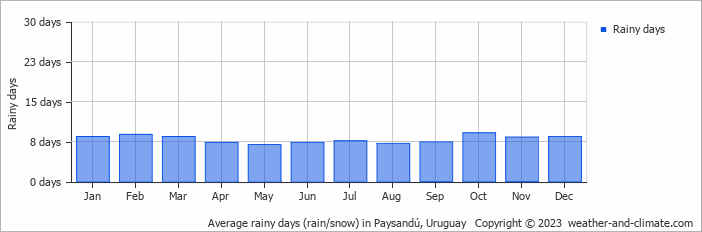
  • On average, October is the most rainy with 9 days of rain/snow.
  • On average, May is the driest month with 6 rainy days.
  • The average annual number of rainy days is 94.

Weather Forecasts for Paysandú

Sun   Apr 28
20°C | 8°C
E 14 km/h
clear and no rain

clear and no rain

Mon   Apr 29
19°C | 14°C
E 14 km/h
5.4 mm
overcast and thunder

overcast and thunder

Tue   Apr 30
23°C | 17°C
NE 11 km/h
6.4 mm
overcast and thunder

overcast and thunder

Interested in more climate information?

Weather and Climate provides you with all the information you need about the climate in Paysandú.

Our site offers climate and forecast data for every country in the world. Are you going to Uruguay? On this website you can find historical weather averages for many cities in Uruguay. Not sure yet where to go? We now have a tool which recommends destinations that suit your ideal climate conditions. Find out where to go with our weather planner.