Monthly Average Rainy days in Nyingchi
The number of days each month with rain, snow and hail in Nyingchi (), China.
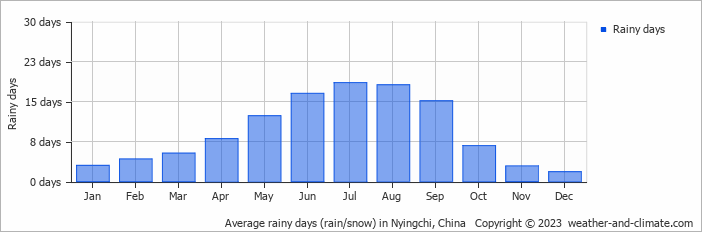
- Most rainy days are in June, July, August and September.
- On average, July is the most rainy with 18 days of rain/snow.
- On average, December is the driest month with 1 rainy day.
- The average annual number of rainy days is 112.
Current rainfall in Nyingchi
Sun Dec 22
7°C | -9°C
S  1 m/s
1 m/s
1 m/s17 mm
broken clouds and sleet
Mon Dec 23
10°C | -15°C
SE 2 m/s
2 m/spartly cloudy and no rain
Tue Dec 24
9°C | -10°C
S 3 m/s
3 m/s1.2 mm
broken clouds and small chance of slight rain


