ClimateForecastMayJune >>

Average monthly rainy days in New Richmond

The number of days each month with rain, snow and hail in New Richmond (Quebec), Canada.

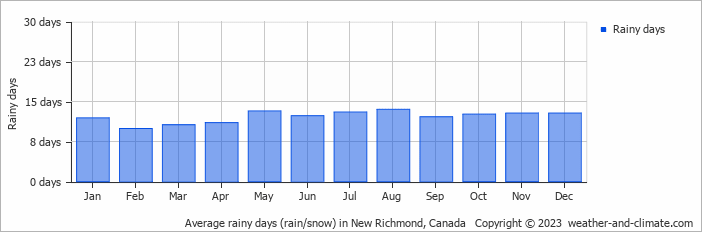
  • On average, August is the most rainy with 13 days of rain/snow.
  • On average, February is the driest month with 9 rainy days.
  • The average annual number of rainy days is 145.

Forecast for New Richmond

Thu   May 16
14°C | 5°C
S 7 km/h
3.2 mm
overcast and rain

overcast and rain

Fri   May 17
18°C | 4°C
S 11 km/h
broken clouds and no rain

broken clouds and no rain

Sat   May 18
17°C | 5°C
S 11 km/h
broken clouds and no rain

broken clouds and no rain

Interested in more climate information?

This site provides you with all the information you need about the climate in New Richmond.

Our site offers climate and forecast data for every country in the world. Are you going to Canada? On this website you can find historical weather averages for many cities in Canada. Not sure yet where to go? We now have a tool which recommends destinations that suit your ideal climate conditions. Find out where to go with our weather planner.