ClimateForecastAprilMay >>

Average monthly rainy days in Melkbosstrand

The number of days each month with rain, snow and hail in Melkbosstrand (Western Cape), South Africa.

Average monthly rainy days in Melkbosstrand,

Feel free to add this climate graph to your website. Click the copy button above.

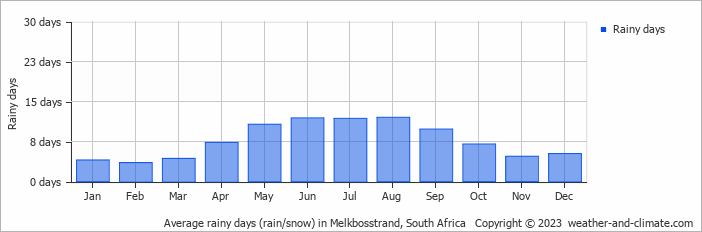
  • On average, August is the most rainy with 12 days of rain/snow.
  • On average, February is the driest month with 3 rainy days.
  • The average annual number of rainy days is 92.

Weather Forecasts for Melkbosstrand

Sat   Apr 20
23°C | 12°C
SW 7 km/h
broken clouds and no rain

broken clouds and no rain

Sun   Apr 21
24°C | 12°C
W 14 km/h
partly cloudy and no rain

partly cloudy and no rain

Mon   Apr 22
24°C | 13°C
W 18 km/h
broken clouds and no rain

broken clouds and no rain

Interested in more climate information?

Weather and Climate provides you with all the information you need about the climate in Melkbosstrand.

Our site offers climate and forecast data for every country in the world. Are you going to South Africa? On this website you can find historical weather averages for many cities in South Africa. Not sure yet where to go? We now have a tool which recommends destinations that suit your ideal climate conditions. Find out where to go with our weather planner.