Average monthly rainy days in Maryville (MO)

The number of days each month with rain, snow and hail in Maryville (Missouri), the United States of America.

Average monthly rainy days in Maryville (MO),

Feel free to add this climate graph to your website. Click the copy button above.

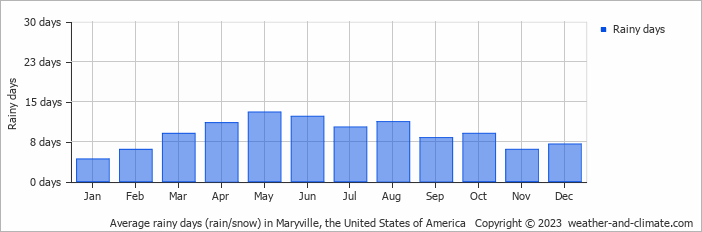
  • On average, May is the most rainy with 13 days of rain/snow.
  • On average, January is the driest month with 4 rainy days.
  • The average annual number of rainy days is 107.

Weather Forecasts for Maryville (MO)

Thu   Mar 28
19°C | 0°C
SW 22 km/h
almost clear and no rain

almost clear and no rain

Fri   Mar 29
22°C | 9°C
S 22 km/h
2 mm
broken clouds and no rain

broken clouds and no rain

Sat   Mar 30
15°C | 5°C
NW 22 km/h
almost clear and no rain

almost clear and no rain

Interested in more climate information?

Weather and Climate provides you with all the information you need about the climate in Maryville.

Our site offers climate and forecast data for every country in the world. Are you going to the United States of America? On this website you can find historical weather averages for many cities in the United States of America. Not sure yet where to go? We now have a tool which recommends destinations that suit your ideal climate conditions. Find out where to go with our weather planner.