Monthly Average Rainy days in Mackinac Island (MI)
The number of days each month with rain, snow and hail in Mackinac Island (Michigan), the United States of America.
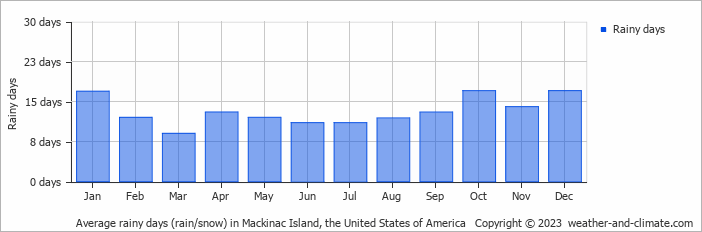
- Most rainy days are in January, October and December.
- On average, October is the most rainy with 17 days of rain/snow.
- On average, March is the driest month with 9 rainy days.
- The average annual number of rainy days is 157.
Current rainfall in Mackinac Island (MI)
Fri Nov 15
8°C | 4°C
NE  11 km/h
11 km/halmost clear and no rain
Sat Nov 16
9°C | 4°C
SE 14 km/h
14 km/hbroken clouds and no rain
Sun Nov 17
12°C | 6°C
SW 25 km/h
25 km/h0.3 mm
broken clouds and slight rain


