Monthly Average Rainy days in Luding
The number of days each month with rain, snow and hail in Luding (), China.
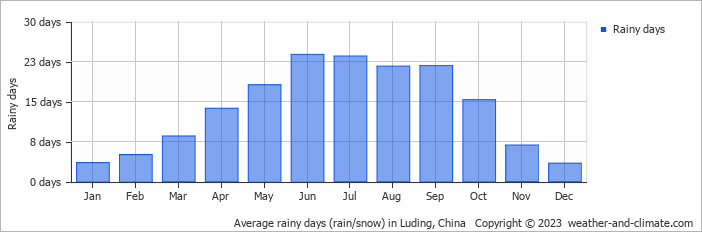
- Most rainy days are in May, June, July, August, September and October.
- On average, June is the most rainy with 23 days of rain/snow.
- On average, December is the driest month with 3 rainy days.
- The average annual number of rainy days is 164.
Current rainfall in Luding
Sun Dec 22
3°C | -3°C
E  3 m/s
3 m/s
3 m/s8.4 mm
broken clouds and chance of snow
Mon Dec 23
14°C | -1°C
E 2 m/s
2 m/s8.9 mm
partly cloudy and small chance of rain
Tue Dec 24
6°C | 0°C
E 3 m/s
3 m/s0.3 mm
partly cloudy and small chance of slight snow


