Monthly Average Rainy days in Limbourg
The number of days each month with rain, snow and hail in Limbourg (Liege Province), Belgium.
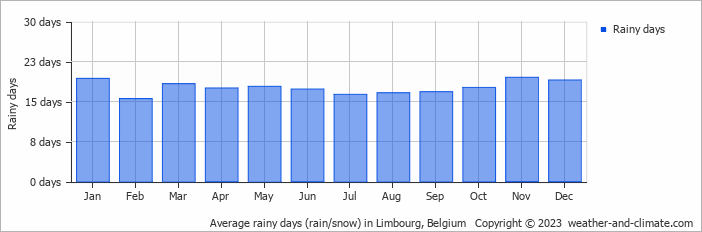
- Most rainy days are in January, February, March, April, May, June, July, August, September, October, November and December.
- On average, November is the most rainy with 19 days of rain/snow.
- On average, February is the driest month with 15 rainy days.
- The average annual number of rainy days is 211.
Current rainfall in Limbourg
Thu Nov 21
1°C | -4°C
SW  18 km/h
18 km/h3.1 mm
broken clouds and small chance of rain
Fri Nov 22
1°C | -4°C
SW 29 km/h
29 km/h8.1 mm
broken clouds and chance of sleet
Sat Nov 23
7°C | -1°C
S 32 km/h
32 km/hovercast and no rain


