Average Rainy - Precipitation days in Le Lude
Over the course of the year, Le Lude experiences 771 mm of rain/snow across 167 days. On this page you will discover more about the number of precipitation days.
Monthly Distribution of Rainy Days
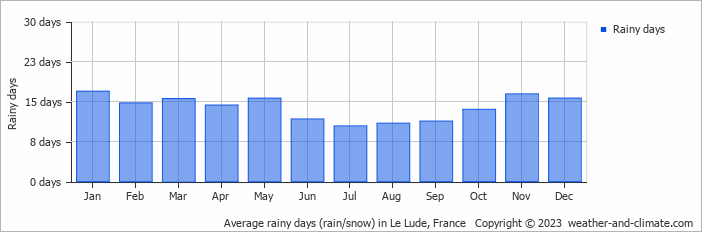
December is usually the wettest with 79 mm of rain over 16 rainy days, whereas July averages 50 mm during its 10 rainy days.
Amsterdam Precipitation Days Compared World Wide
Le Lude's average annual precipitation falls over 167 days. Let's compare this to some popular worldwide tourist destinations:
In Cairo, Egypt, there are only about 16 precipitation days annually, making it one of the driest capitals in the world.
In Bogotá, Colombia, there are around 188 precipitation days annually, typical for its high-altitude tropical climate.
Seville, Spain, experiences 103 precipitation days annually, with wet winters and dry summers typical of southern Spain.
Chicago, USA, has 133 precipitation days annually, with a mix of rain and snow.
Buenos AiresBuenos Aires, Argentina, has around 92 precipitation days annually, mostly during the summer months.
In Brisbane, Australia, the city averages 123 precipitation days per year, making it wetter than Sydney.
Rain Facts From Around the Globe
Here are some amazing facts about rain and precipitation worldwide:
- Cherrapunji, India, records an average of 322 rainy days each year. Despite this, the wettest place is Mount Waialeale in Hawaii with 11500 mm annual rainfall.
- The fastest recorded raindrop fell at 18 meters per second during a thunderstorm in Brazil.
- The Atacama Desert in Chile is so dry that some weather stations have never recorded rainfall since their installation.
- The largest recorded raindrop measured 8.8 mm in diameter during a tropical storm on La Réunion Island.
- Some clouds can weigh up to 500,000 tons, that's equivalent to the weight of 100 elephants.
For more detailed information about rainfall patterns in Le Lude, visit our Rainfall & Precipitation page.
Current rainfall in Le Lude