Monthly Average Rainy days in Las Playitas
The number of days each month with rain, snow and hail in Las Playitas (Canary Islands), Spain.
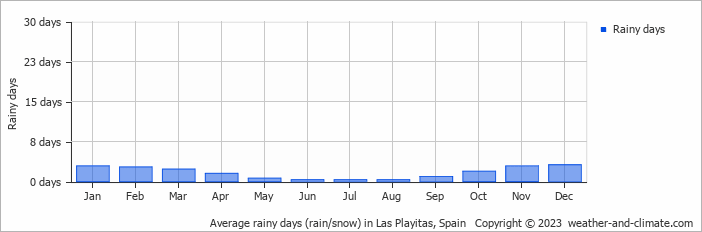
- Las Playitas has dry periods in April, May, June, July, August, September and October.
- On average, December is the most rainy with 3 days of rain/snow.
- On average, August is the driest month with 0 rainy days.
- The average annual number of rainy days is 19.
Current rainfall in Las Playitas
Tue Dec 03
25°C | 19°C
NE  32 km/h
32 km/halmost clear and no rain
Wed Dec 04
24°C | 19°C
NE 36 km/h
36 km/halmost clear and no rain
Thu Dec 05
24°C | 19°C
NE 32 km/h
32 km/hbroken clouds and no rain


