Average monthly rainy days in La Torre
The number of days each month with rain, snow and hail in La Torre (), Peru.
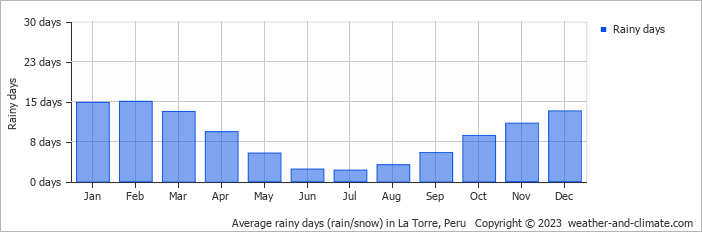
- Most rainy days are in February.
- On average, February is the most rainy with 15 days of rain/snow.
- On average, July is the driest month with 2 rainy days.
- The average annual number of rainy days is 103.
Weather Forecasts for La Torre
Mon Apr 29
33°C | 24°C
NW  7 km/h
7 km/h1.5 mm
partly cloudy and chance of slight rain
Tue Apr 30
34°C | 24°C
NW 7 km/h
7 km/h1.4 mm
partly cloudy and slight rain
Wed May 01
33°C | 24°C
NW 7 km/h
7 km/h2 mm
partly cloudy and rain


