Monthly Average Rainy days in La Pintada
The number of days each month with rain, snow and hail in La Pintada (Antioquia), Colombia.
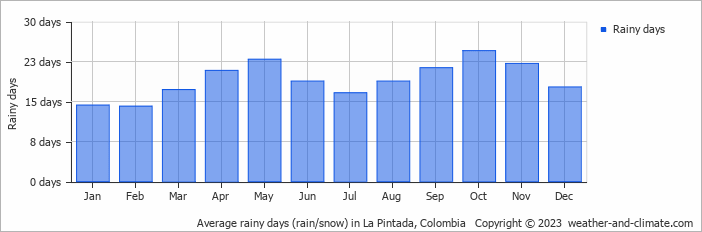
- Most rainy days are in March, April, May, June, July, August, September, October, November and December.
- On average, October is the most rainy with 24 days of rain/snow.
- On average, February is the driest month with 14 rainy days.
- The average annual number of rainy days is 229.
Current rainfall in La Pintada
Sun Dec 15
37°C | 26°C
S  7 km/h
7 km/h3.6 mm
broken clouds and thunder
Mon Dec 16
37°C | 27°C
SE 4 km/h
4 km/h2.6 mm
broken clouds and thunder
Tue Dec 17
39°C | 26°C
W 4 km/h
4 km/h0.6 mm
partly cloudy and slight rain


