Monthly Average Rainy days in La Cavada
The number of days each month with rain, snow and hail in La Cavada (Cantabria), Spain.
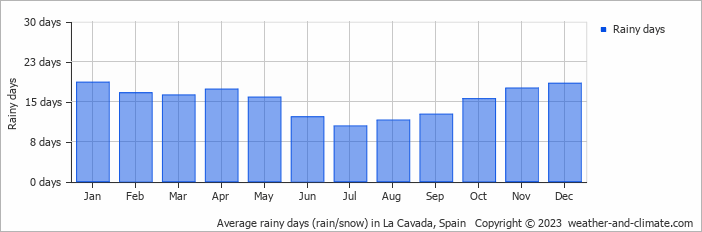
- Most rainy days are in January, February, March, April, May, October, November and December.
- On average, January is the most rainy with 18 days of rain/snow.
- On average, July is the driest month with 10 rainy days.
- The average annual number of rainy days is 182.
Current rainfall in La Cavada
Fri Nov 15
20°C | 7°C
SE  7 km/h
7 km/halmost clear and no rain
Sat Nov 16
20°C | 10°C
S 11 km/h
11 km/hpartly cloudy and no rain
Sun Nov 17
15°C | 10°C
N 7 km/h
7 km/h1.4 mm
overcast and rain


