Monthly Average Rainy days in Kunming
The number of days each month with rain, snow and hail in Kunming (Yunnan), China.
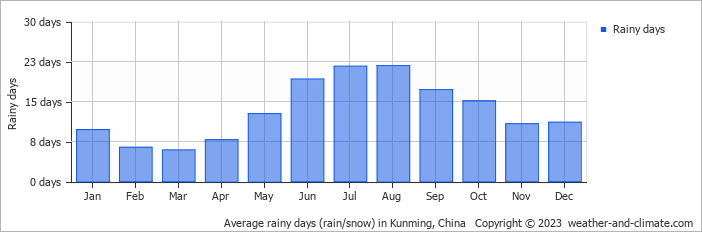
- Most rainy days are in June, July, August, September and October.
- On average, August is the most rainy with 21 days of rain/snow.
- On average, March is the driest month with 5 rainy days.
- The average annual number of rainy days is 159.
Current rainfall in Kunming
Sun Dec 22
16°C | 8°C
SW  4 m/s
4 m/s
4 m/s0.4 mm
broken clouds and small chance of slight rain
Mon Dec 23
17°C | 6°C
W 3 m/s
3 m/s0.2 mm
partly cloudy and small chance of slight rain
Tue Dec 24
18°C | 5°C
SW 4 m/s
4 m/spartly cloudy and no rain


