Monthly Average Rainy days in Koh Rong Island
The number of days each month with rain, snow and hail in Koh Rong Island (Preah Sihanouk Province), Cambodia.
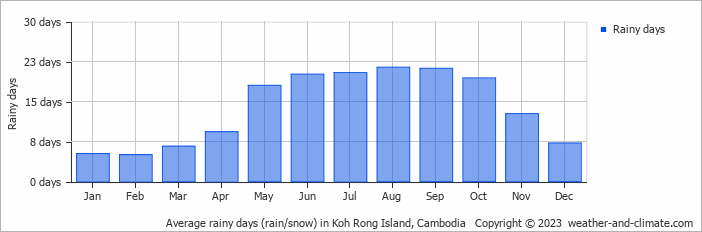
- Most rainy days are in May, June, July, August, September and October.
- On average, August is the most rainy with 21 days of rain/snow.
- On average, February is the driest month with 5 rainy days.
- The average annual number of rainy days is 166.
Current rainfall in Koh Rong Island
Wed Jan 15
30°C | 25°C
NE  7 m/s
7 m/s
7 m/s3 mm
almost clear and small chance of slight rain
Thu Jan 16
31°C | 25°C
NE 10 m/s
10 m/salmost clear and no rain
Fri Jan 17
30°C | 25°C
NE 10 m/s
10 m/spartly cloudy and no rain


